Months, Not Years: How BAR Technologies Proved Wind Propulsion Pays Back in Carbon in much less than a year
Background
BAR Technologies isn’t a typical marine engineering firm. Born in 2017 from decades of high-performance competition in the America’s Cup and Formula One, the company has built a reputation for solving technically complex challenges with disruptive innovation.
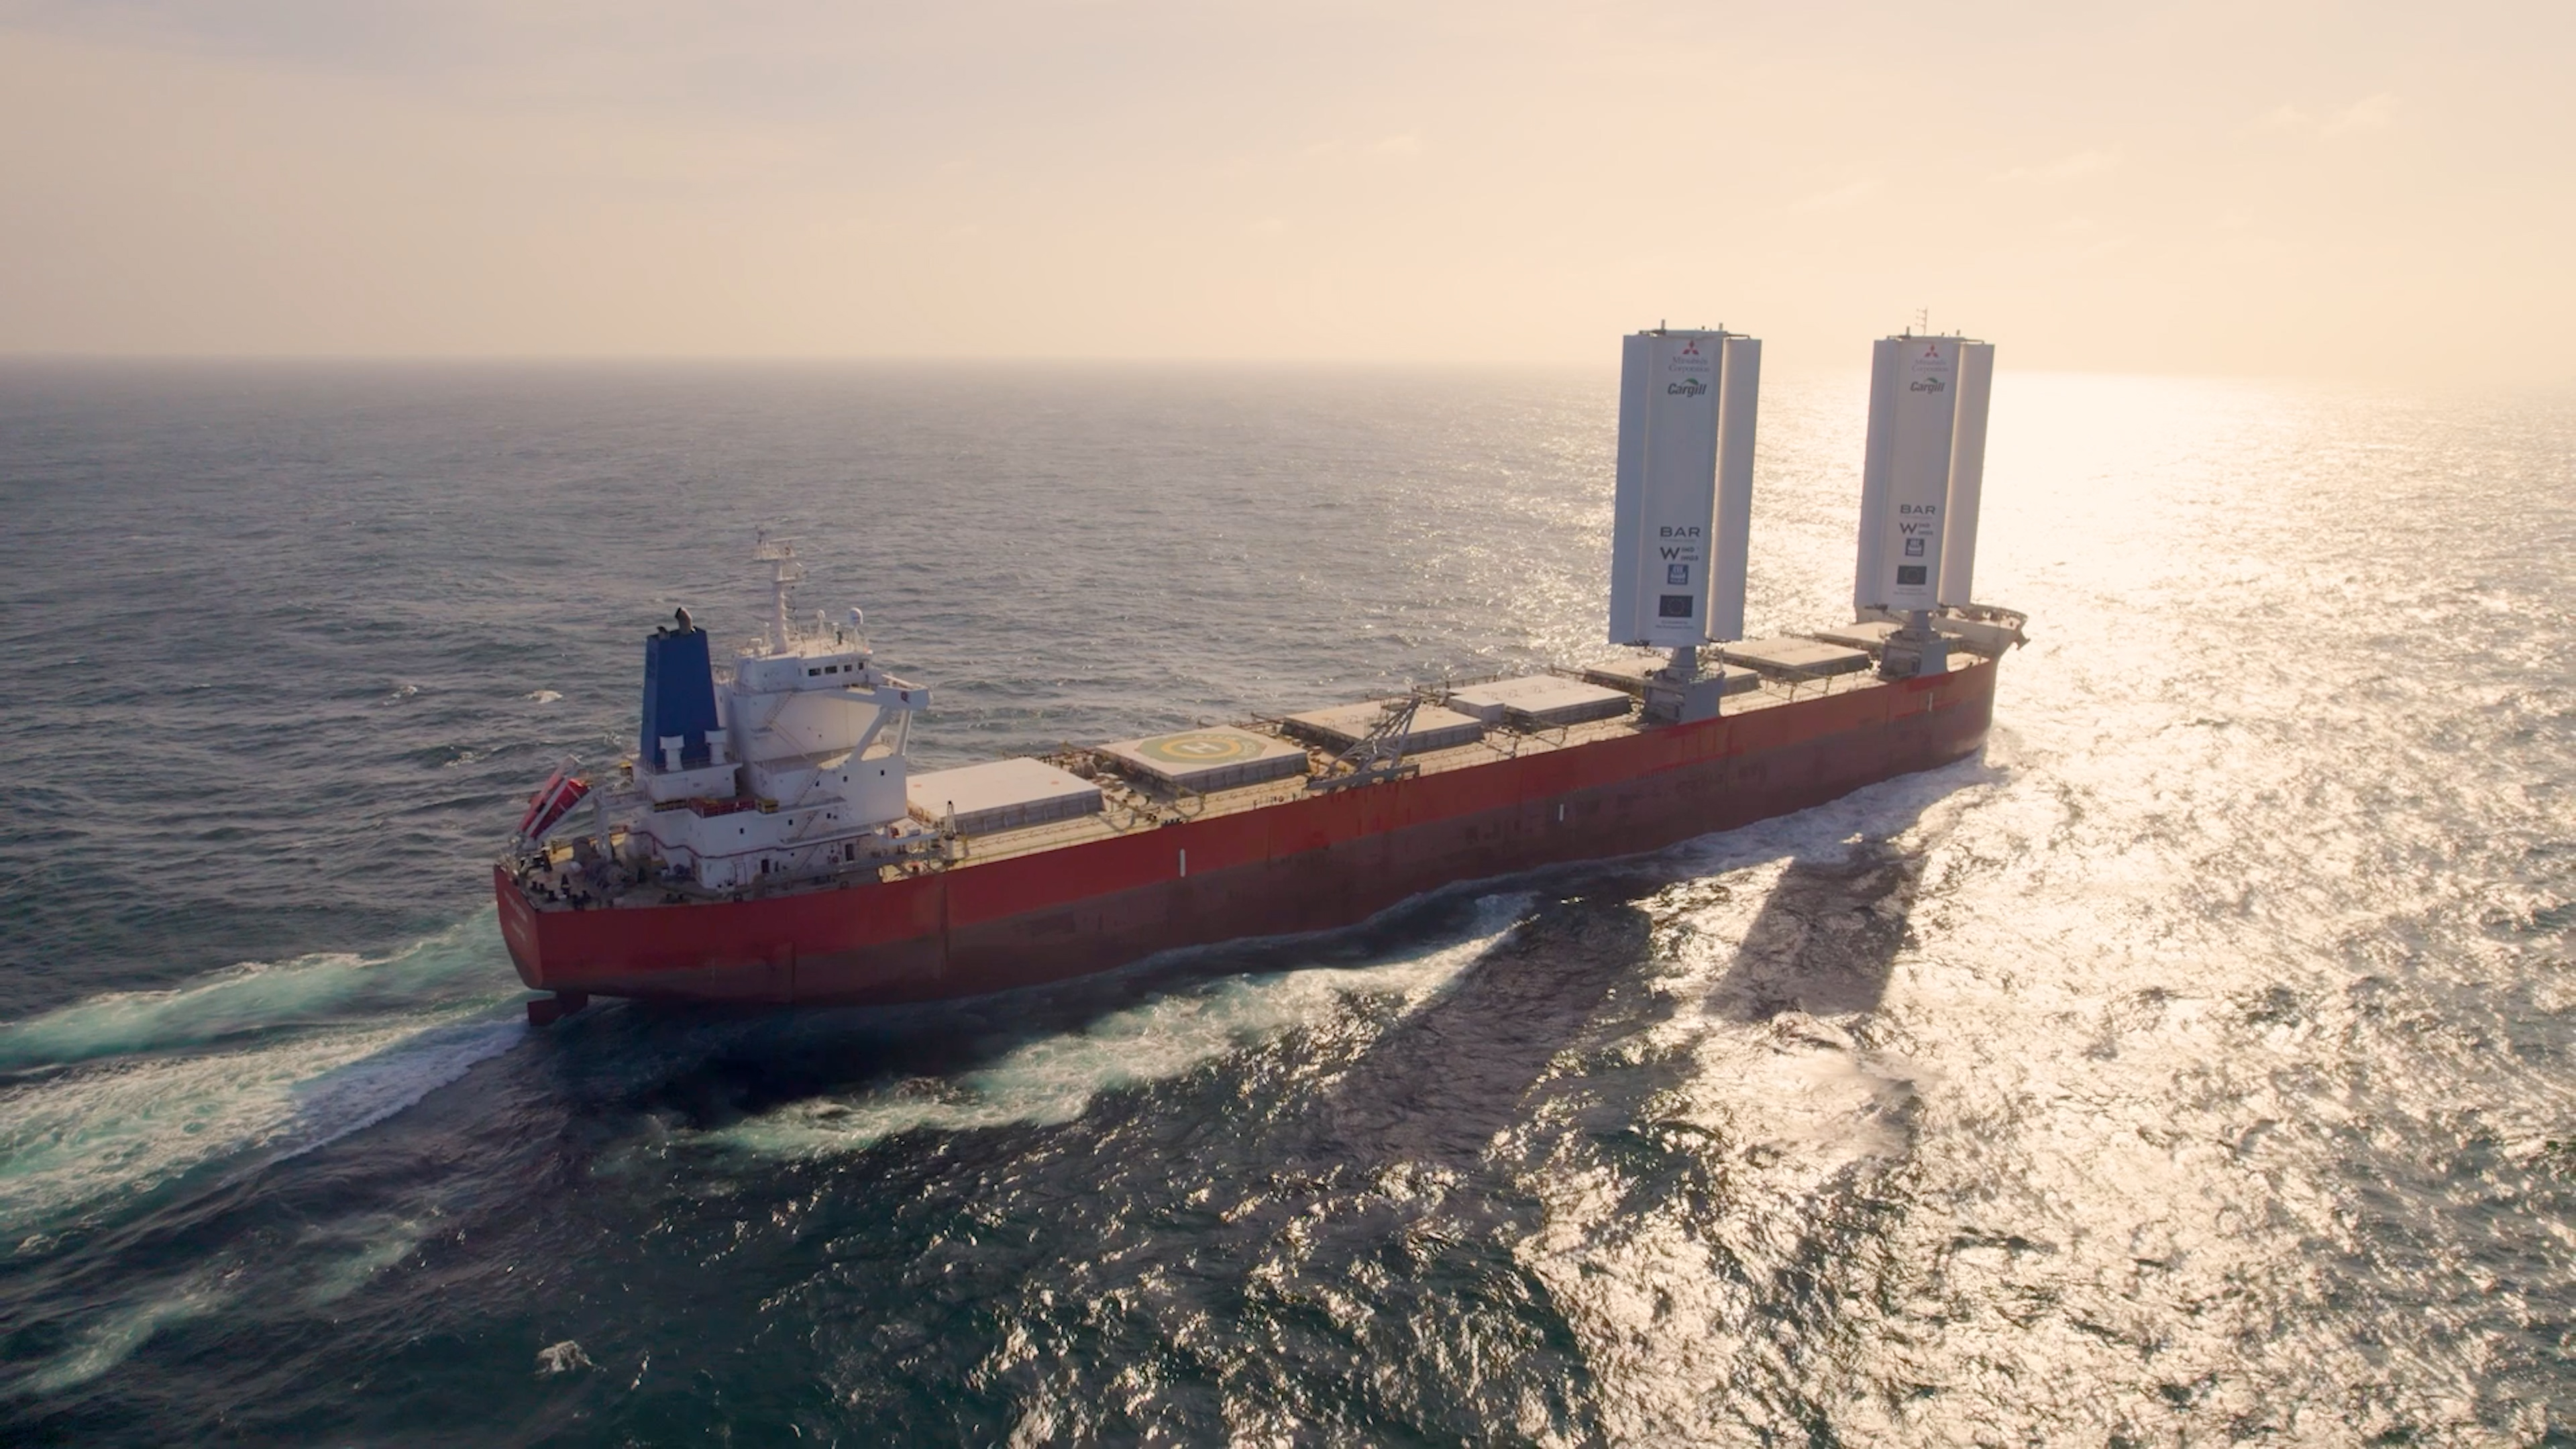
One of its flagship projects is transforming commercial shipping through the use of wind-assisted propulsion. Its WindWings® system is a three-element wing sail designed to reduce fuel consumption by 1.5 tonnes per wing per day and CO₂ emissions by 4.7 tonnes per day on average on global shipping routes.
The timing is critical. The International Maritime Organization (IMO) has set ambitious decarbonisation targets, regulators are backing them with regional carbon taxes, and shipowners are under mounting pressure to cut emissions and prove it with data.
BAR Technologies positions its work squarely around decarbonisation, backed by a shareholder group that insists sustainability sits alongside more traditional corporate targets.
The business case for WindWings® was clear: shipowners could save millions in fuel over a vessel’s lifetime while cutting their direct emissions. But one question kept coming back: if building a WindWing carries its own carbon footprint, how long does it take to pay that back?
The Challenge
In 2025, BAR Technologies joined the first MarineShift360 Impact Accelerator, a ten-month programme giving marine innovators the tools, expert support and structure to embed lifecycle assessment (LCA) into design and supply decisions.
For BAR Technologies, the task was to conduct a robust LCA of its WindWings® technology, use the data to refine material and design choices where they mattered most, and embed carbon literacy across teams.
But there was also a bigger test. BAR wanted to prove that a WindWing could repay its carbon debt quickly enough to withstand scrutiny from naysayers, shipowners, regulators and competitors, and to show the wider industry that lifecycle transparency is both possible and necessary.
The Turning Point
When the first LCA results landed, the team felt vindicated in their careful design approach.
Based on baseline assumptions, the carbon debt was cleared in approximately six months, and even under conservative scenarios, the payback period remained under a year.
A single 24m WindWing carried a production footprint of around 174 tonnes of CO₂e. But on a typical product tanker crossing the Atlantic, it could save around 600 tonnes of CO₂e per year.
It’s important to note, that at this stage the study is ISO 14044-aligned and currently excludes the minimal footprint of maintenance and end-of-life impact.
Will Hopes, Simulation and Performance Engineer at BAR Technologies said: “Seeing it come out in months is justification of our careful approach to carbon footprint during the design phase. We believed we had done a good job, and this work with MarineShift360 has validated our method. It has added a new emphasis on the way we describe and market our WindWing products.”
Why Carbon Payback Matters
In shipping, technologies are often branded “green” because they save fuel in operation. But if building them carries a heavy footprint, it can take years, sometimes decades, before they deliver a net benefit.
That’s the danger of focusing on surface-level change: switching out an engine, electrifying propulsion, or adding a “green” material without truly understanding the system-wide implications. A product can look sustainable on the water while hiding an enormous carbon debt from its manufacture. If the payback is too long, it may never deliver a net saving within the vessel’s lifetime.
Understanding carbon payback solves this. It’s the point where emissions saved in operation outweigh the emissions used to build the product. The shorter the payback, the faster the technology delivers real climate benefit.
And that’s why LCA is essential. Without it, the industry is shooting in the dark, chasing trend-driven solutions that sound sustainable, but may never deliver proof.
For BAR Technologies, the lifecycle results showing a WindWing pays back its footprint in less than a year demonstrated that the solution delivers measurable climate benefit, and on a timescale that matters.
What the Data Revealed
The LCA uncovered insights that challenged assumptions:
- Metalwork was the single largest contributor to embedded CO₂e (44%), ahead of composites (24%), fit-out (16%), electrical (14%)
- Tooling can dominate at low utilisation, but falls to 2% per wing at high pulls; total plug and mould impact is large in absolute terms, so maximising uses materially reduces per-wing footprint.
- Results are sensitive to use-phase assumptions (route, utilisation, number of wings) and to supply-chain choices such as recycled content in steels and composite lay-ups
“In my mind it was all about end-of-life composites,” Hopes said. “The study showed metalwork is a real swing factor. That was a surprise, and an easy lever to pull.”
From Insight to Action
Armed with the data, BAR Technologies began changing its decisions:
- Procurement specs for DH32 steel now call for high recycled content and Electric Arc Furnace (EAF) production processes wherever possible, to drive down embedded emissions in metalwork.
- Mould makers are being engaged on recycled inputs and on maximising pulls per tool to spread the footprint.
- Composite stack-ups are being reviewed (e.g., recycled PET cores) with consumables used in infusion targeted for reduction.
The Impact Accelerator provided the structure to keep moving, including regular modelling sprints, expert clinics, and peer accountability across the cohort. What might have taken years was compressed into months.
The carbon payback study gave BAR Technologies the data it needed to validate its design choices, and at the same time, it armed the commercial team with a compelling new proof point for shipowners, regulators, and partners.
The Results
Receiving validation that a WindWing repays its carbon footprint in under 6 months on the baseline model aligns with BAR Technologies’ company vision to drive marine sustainability through disruptive innovation.
Where design reviews once weighed mass, cost and performance, carbon payback is now being integrated alongside those metrics.
Carbon literacy has spread across the business. Engineers, sales and procurement teams have begun factoring lifecycle impact into conversations, and supplier briefs now include recycled-content targets and data-quality expectations aligned to ISO 14044.
“It’s about making the whole organisation more carbon literate,” said Hopes. “That way the discussion doesn’t just happen in a sustainability silo. It happens everywhere.”
The result isn’t just a more credible product, it’s a more resilient company. One ready to compete not only on performance and price, but on lifecycle proof.
What This Means for the Industry
Wind propulsion is often talked about as a future solution. BAR’s results show it is a present one, with a payback so short it reframes the debate from “does it help?” to “how fast can we deploy it?.”
Just as importantly, the approach raises the bar on transparency. By sharing assumptions, advocating for common rules, and planning external reviews, BAR is setting an example for credible claims.
“By publishing this, we encourage competitors to do the same,” Hopes said. “That’s how the whole industry moves forward.”
Next steps include replacing any proxies used with primary data from suppliers; extending scope to include maintenance and end-of-life impacts; and seeking external critical review for the LCA. The payback lens will be applied across future wing sizes and vessel types, ensuring every new product carries the same lifecycle discipline.
What began as a difficult question, how fast does a WindWing repay its own carbon cost?, has become a competitive advantage.
The answer is not only yes, but faster than anyone expected, and communicated with the transparency and caution the industry needs.
And for an industry under pressure from carbon taxes, tightening regulation, and customer demand for proof, that matters.
.png)